


5 Customer Service KPIs You Should Track
Great support is the backbone of almost every business, the daily contact that decides whether a buyer stays or walks away. Delivering it is only half the job, though. The harder question is this: how do you know it’s actually working? That’s where customer service KPIs come in. These call center metrics turn something subjective, like “our team is good,” into numbers you can track, compare, and act on. Without them, you’re managing your most important touchpoint on gut feel alone.
Customer service performance directly affects how customers perceive a business, especially in high-volume environments where response times, resolution rates, and satisfaction can influence whether someone returns or takes their business elsewhere. For companies operating in retail, strong retail customer service depends on consistently tracking these metrics to identify service gaps, improve agent performance, and maintain a reliable customer experience across every interaction.
What Are Customer Service KPIs and Why They Matter Most?
Support KPIs are measurable indicators that show how well a team performs across speed, quality, and outcomes. The five most common are First Response Time, Average Resolution Time, CSAT, NPS, and Customer Retention Rate. Each isolates a different part of the buyer experience, so leaders know exactly what to fix instead of guessing.
They matter because they connect everyday support work to business results. A slow response isn’t just an operational hiccup; it’s an early warning of churn. A rising satisfaction score isn’t a vanity number; it’s evidence that a process change is working. Tracked together, these metrics measure performance from the very first interaction all the way to long-term loyalty, and they turn vague goals into targets you can manage. Capturing them is far easier when your contact center solutions are built to record each conversation on every channel.
The point isn’t to collect every possible metric; it’s to track the handful that actually predict whether buyers stay, and to review them often enough to act on what they show.
| KPI | What it measures | How it’s calculated | Why it matters |
| First Response Time (FRT) | Time to the first reply after a buyer reaches out | Total first-response time ÷ number of tickets | Sets the tone for the whole interaction |
| Average Resolution Time (ART) | Time to fully resolve an issue | Total resolution time ÷ resolved tickets | Long fixes push people to competitors |
| Customer Satisfaction Score (CSAT) | How happy someone is right after a contact | (Positive replies ÷ total replies) × 100 | Direct, immediate read on service quality |
| Net Promoter Score (NPS) | Loyalty and likelihood to recommend | % Promoters minus % Detractors | Predicts word-of-mouth growth and churn risk |
| Customer Retention Rate (CRR) | Share of accounts kept over a period | ((End count minus new) ÷ start count) × 100 | The financial proof that service works |
First Response Time (FRT): Why Your First Reply Sets the Tone
First Response Time measures how long a buyer waits for an initial human reply after reaching out. It’s often the most important KPI on this list, because the speed of that opening answer sets the tone for the entire relationship. A fast, confident response tells the person they’re in good hands, even before the problem is solved. A slow one leaves them wondering whether anyone is listening at all.
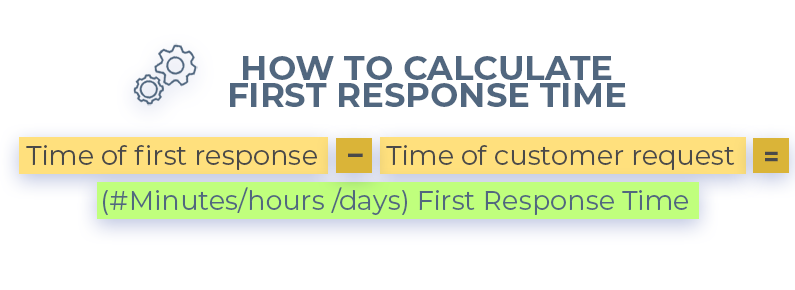
How to calculate FRT: divide the total time to first response across all tickets by how many tickets you handled in the period. The real value comes from tracking it per channel, because expectations differ sharply. Buyers will tolerate a few hours on email but expect near-instant answers on live chat and phone. A single blended average can hide a serious problem on your fastest queue, so segment the figure before you celebrate it. Set a target for each channel and watch the trend, not just the daily total.
Average Resolution Time (ART): Measuring the Complete Fix
Average Resolution Time picks up where First Response Time leaves off. It measures how long it takes to fully solve an issue, not just acknowledge it. A quick opening reply means little if the actual fix drags on for days while the buyer waits, follows up, and grows frustrated.
How to calculate ART: divide the total resolution time across closed tickets by how many you closed in the period. The goal is to keep this figure as low as possible without sacrificing quality. That balance matters, because a rushed fix that returns a day later is worse than a slightly slower one that actually sticks; repeat cases quietly inflate both your workload and the buyer’s frustration. Watch ART alongside your reopen rate so you can separate fast, effective help from slow, sloppy work. When the metric climbs, it usually points to a training gap, a broken process, or a knowledge base that agents can’t rely on.

Customer Satisfaction Score (CSAT): A Direct, Immediate Read
CSAT is a direct read on how buyers feel right after an interaction. It’s usually captured with a short survey sent the moment a contact ends, asking questions such as:
- How satisfied are you with your interaction with our team?
- How satisfied are you with the product or service?
- Do you have any comments about this interaction?
- Do you have any comments about the product or service?
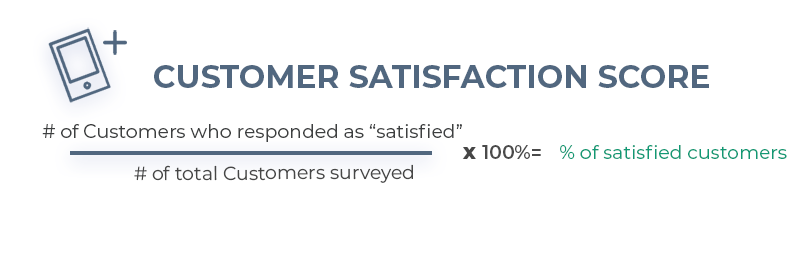
How to calculate CSAT: divide the count of positive replies by the total number you received, then multiply by 100. Because it’s tied to a specific moment, CSAT is the fastest metric to act on; a dip after one change or on a single team is easy to trace back to its cause. It gives you the clearest view of how strong customer service supports your business on every contact. And while a survey only captures the people who bother to respond, modern speech and interaction analytics make it possible to gauge satisfaction and resolution quality across far more conversations than a poll can reach alone.
Net Promoter Score (NPS): Measuring Loyalty and Referrals
Where CSAT captures a fleeting moment, NPS steps back to measure loyalty and word-of-mouth, not just satisfaction. It asks one deceptively simple question: how likely is a buyer to recommend you to a friend or colleague, on a scale of 0 to 10? The metric grew out of research into the single survey question that predicts loyalty and growth, the idea that a willingness to refer you is the strongest signal of all.
How to calculate NPS: subtract the share of detractors (those who rate you 0 to 6) from the share of promoters (who rate you 9 to 10); passives at 7 or 8 are left out. The result tells you which way your audience is leaning. A great interaction won’t always create a promoter, but it reliably prevents detractors, and unhappy voices are what quietly erode a base through negative reviews. Used together, CSAT and NPS give you the full scope of experience measurement: one shows how a moment felt, the other shows whether that feeling adds up to loyalty.

Customer Retention Rate (CRR): The Real Financial Proof
CRR is last on the list but arguably the most consequential, because retention is the clearest financial proof that your service works. It measures the share of buyers you keep over a given period. Where the other four KPIs describe the quality of individual interactions, this one shows whether all that effort actually turns into people who stay.
How to calculate CRR: take how many accounts you have at the end of a period, subtract any you won during it, divide by the count you started with, then multiply by 100. Strong retention is the downstream result of getting First Response Time, resolution speed, satisfaction, and loyalty right, which is why executives tend to care about it most. Because of the outsized financial impact of keeping existing buyers, even a small lift here can move profit meaningfully, since loyal accounts cost less to serve and tend to spend more over time.
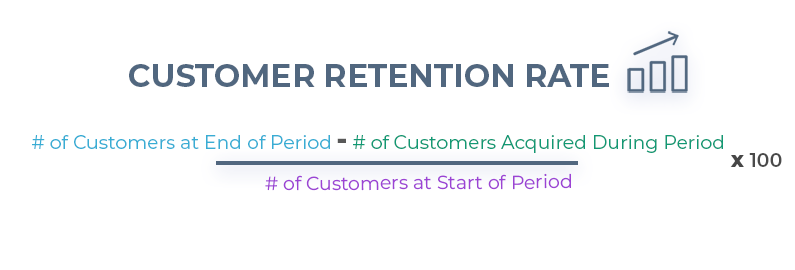
How to calculate Customer Retention Rate (CRR)
From these points, we can identify how the procedures in place effectively impact the relationship between your business and your client; if these KPIs aren’t met, then actions should be taken to identify any pitfalls or improvements.
Missing out on the FRT or ART can produce a chain reaction in how your clients interact with your service; they may avoid contacting Customer Service altogether and find out other services that provide a faster and more effective response time.
The CSAT is the microscope that gives you the best insight on how satisfied your clients are with their interaction with Customer Service and your current selection of services; if this KPI is not addressed accordingly or not attended at all, your clients may feel ignored and that their opinion is of no concern to your business which in turn may produce detractors.
What Happens When You Ignore Customer Service KPIs Entirely
Skip these metrics and problems compound quietly, out of sight, until they show up in revenue. Miss on response or resolution times, and buyers stop bothering to reach you at all; they simply find a provider who answers faster. Ignore CSAT, and dissatisfied clients feel unheard, which is exactly how a happy account turns into a detractor. Overlook NPS, and that unhappy base grows unchecked until it starts dragging down new business through reviews and referrals that never happen.
The stakes are higher than they look. Research on how quickly a poor experience pushes customers away shows that more than half of consumers will stop buying from a brand after one bad interaction, and a single misstep is often enough to lose them for good. The pattern is consistent: the companies that fall behind rarely do so because of one dramatic failure. They slip because small, unmeasured problems were allowed to repeat until buyers quietly left.
How to Turn Your Customer Service KPIs Into Better Service?
Measuring is only step one. The value comes from acting on what the numbers reveal, and doing that consistently as volume grows. These metrics matter because of how customer service drives business growth; each ties directly back to revenue and loyalty, so a shift in the figure should always prompt a question about the process behind it.
A few practical moves make the difference:
- Response and resolution times improve when people can reach you on their preferred channel, one of the benefits of omnichannel customer support.
- If your in-house crew can’t hold those times steady as volume grows, an outsourced customer service team can absorb the load without letting these KPIs slip.
- Which metrics deserve the most attention shifts over time, so it’s worth watching the customer service trends shaping 2026 alongside your own numbers.
The teams that win treat these KPIs as a feedback loop, not a scorecard; every number is a prompt to fix something specific.
Ready to Raise Your Customer Service KPIs Across Channels?
If tracking these metrics has revealed gaps your current setup can’t close, Redial can help. Our people are built to hit and hold these KPIs across every channel, from first response through long-term retention. Talk to our CX team or get a free quote to see what world-class support looks like in numbers.
Frequently Asked Questions
Frequently Asked Questions Aboiut Customer Service KPIs
1. What are the most important customer service KPIs to track?
The five most widely used support KPIs are First Response Time, Average Resolution Time, Customer Satisfaction Score (CSAT), Net Promoter Score (NPS), and Customer Retention Rate. Together they measure speed, quality, satisfaction, loyalty, and business impact. Most teams start with the first two because they are the fastest to act on.
2. What is a good First Response Time for customer service?
A strong First Response Time depends on the channel: live chat and phone are expected within seconds to a couple of minutes, while email is commonly answered within a few hours. The key is consistency against the expectation people hold for each channel, not a single universal number. Track it per queue rather than as one blended average.
3. What’s the difference between CSAT and NPS?
CSAT measures how satisfied someone is with a specific interaction, captured right after it happens. NPS measures overall loyalty and how likely a buyer is to recommend you. The first is a short-term quality signal; the second is a longer-term growth signal. Most teams track both to see the full picture.
4. How often should you review your customer service KPIs?
Most teams review operational metrics like First Response Time and Average Resolution Time weekly, since they change quickly and flag problems early. Loyalty and retention figures such as NPS and Customer Retention Rate are usually reviewed monthly or quarterly because they move more slowly. The right cadence is frequent enough to catch issues before they reach the buyer.
5. How does tracking customer service KPIs improve business results?
These metrics turn service quality into numbers you can act on. Falling response or satisfaction scores flag problems before they cause churn, while rising retention and NPS confirm that improvements are working. Because keeping an existing account is far cheaper than winning a new one, small gains here protect revenue directly.